Example Repository
We’re going to be playing around with some of the examples in this repository.
Visual Studio Code offers a few ways for debugging your code.
- You can set breakpoints on lines of code where you want execution to pause.
- While paused, you can inspect variables, call stacks, and evaluate expressions to see what’s going on.
- You can step through code line by line (Step Over, Step Into functions, Step Out) to follow the logic flow.
- You can even change variables on the fly to test different scenarios.
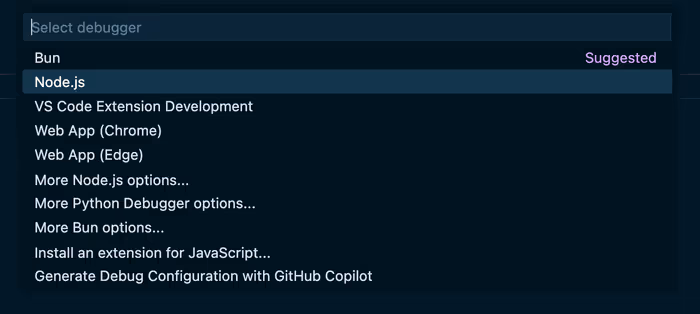
There are a bunch of templates that Visual Studio Code provides to get up and running quickly.
Together
We’re going to walk through the maths example in [this repository].
Exercise: Debugging an Express Application
Set up a launch.json. Here is a example of a super simple launch.json.
{
	"version": "0.2.0",
	"configurations": [
		{
			"type": "node",
			"request": "launch",
			"name": "Launch Program",
			"skipFiles": ["<node_internals>/**"],
			"args": ["${workspaceFolder}/index.js"]
		}
	]
}